
The three whole-pie presets
| Preset | 2030 share | 2040 share | 2050 share |
|---|---|---|---|
| Conservative thesis | 1.25% | 5.00% | 10.00% |
| Mark’s thesis | 1.50% | 8.00% | 15.00% |
| High adoption | 2.00% | 10.00% | 20.00% |
Mark’s Thesis is the default. It assigns Bitcoin 1.5%, 8% and 15% of the modeled combined pie at the three milestones. The earlier 1.25% / 5% / 10% path remains available as “Conservative thesis.” That name means lower assumed capture relative to the other presets, not objectively low risk, a confidence level or a statistically conservative forecast.
The High Adoption preset uses 2%, 10% and 20%. None of these is a measured future adoption rate. The numeric controls also accept custom shares and do not require them to increase over time.
[MODEL]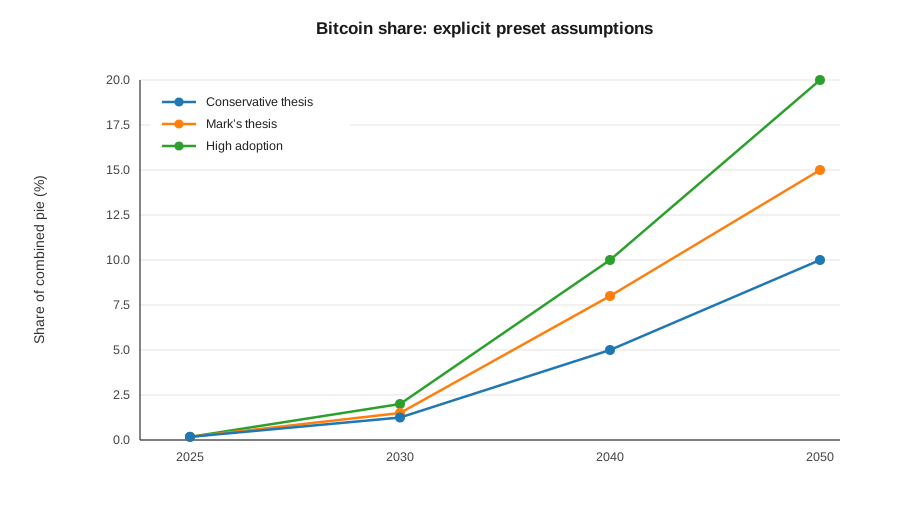
What the default calculates
| Year | Combined pie | Bitcoin share | Implied nominal BTC price |
|---|---|---|---|
| 2030 | $1,454.23T | 1.50% | $1,060,562 |
| 2040 | $2,990.69T | 8.00% | $11,433,564 |
| 2050 | $6,152.87T | 15.00% | $43,977,147 |
These prices are arithmetic consequences of the chosen market path and capture fractions. They are not fixed annual Bitcoin growth-rate inputs, nor does the calculator estimate the probability of reaching them.
The strongest explanation is conditional: “This is my adoption thesis. Here is the projected market it applies to, and here is what the math implies.” Readers can disagree with either the market path or the share assumptions without disputing the arithmetic.
[MODEL]What would have to happen?
For the stronger paths to be persuasive, Bitcoin would need to move beyond occasional trial positions into durable savings behavior. Distribution would have to broaden, custody and operating practices would have to support continued participation, and enough holders would need to retain or increase their allocations through difficult periods.
Institutional and treasury adoption would need to be economically meaningful, not merely permission to purchase a small amount. Digital commerce or AI use would need to create sustained balances rather than transaction volume alone. Alternative stores of value and competing monetary technologies would still exist.
These are underwriting conditions, not five newly fitted coefficients. The model supplies no independent probability that they occur. A 15% share of this gross comparison universe is a substantial monetary-adoption thesis even though other large categories can still be larger.
[MODEL][AI-BTC][AI-USDC]Whole-pie share and category capture answer different questions
Simple mode asks, “What percentage of the entire combined universe does Bitcoin represent?” A 15% answer determines Bitcoin’s total capitalization and the aggregate residual. It does not uniquely determine how much gold or property remains.
By-market mode asks, “What effective fraction of each category is attributed to Bitcoin?” The program sums those contributions, subtracts each from its counterfactual category allocation, and calculates the resulting Bitcoin share.
The reset values in By-market mode are retained illustrative category settings, not a derivation of Mark’s whole-pie preset. Other credit mechanically matches the bond setting. Both modes preserve one finite pie, but their inputs are intentionally independent.
Bitcoin versus remaining gold appears only in By-market mode. At 100% gold capture, remaining gold is zero and the ratio is undefined; the app says so instead of displaying a misleading infinity.
[MODEL]A worked example with round numbers
Suppose the projected comparison universe were $2 quadrillion, Bitcoin’s assumed share were 5%, and the supply denominator were 21 million. Bitcoin capitalization would be $100 trillion. Dividing that by 21 million produces approximately $4.76 million per coin.
That is an illustration of the equation, not one of the released milestone forecasts. The app uses the retained, more precise pie and supply values. A large calculated capitalization does not mean the model has estimated an equal quantity of new cash inflows.
[MODEL]