
Three comparable-core anchors, not fifty complete annual observations
The retained five-category core includes money, gold, property, debt securities and equities. It excludes art and the later loan addition because matching historical stocks were not established. The historical money series is scaled to the working global anchor; it is not a direct worldwide census at each date.
| Anchor year | Five-category core | Money proxy, scaled | Coverage |
|---|---|---|---|
| 2015 | $451.78T | $75.21T | Art and added loans excluded |
| 2020 | $684.63T | $108.74T | Art and added loans excluded |
| 2025 | $896.97T | $144.00T | Art and added loans excluded |
The 2025 historical-core total is therefore smaller than the corrected seven-category starting basket. We do not join those two totals into one uninterrupted historical growth chart.
[MODEL][MONEY][PROPERTY-OLD][SECURITIES]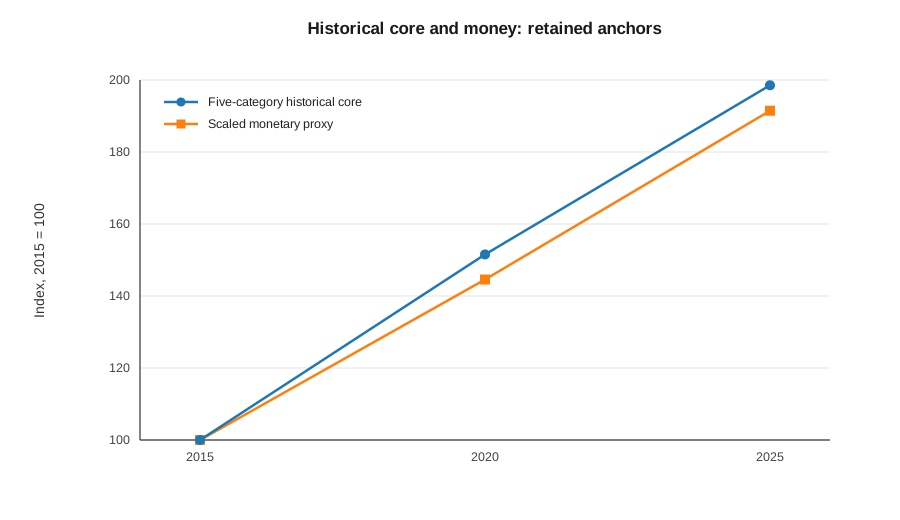
Measure elapsed time, not the number of rows
For comparable endpoints, annualized growth is (ending value / starting value)^(1 / elapsed years) − 1. A five-row lag is not necessarily five years. That distinction mattered when the early source files contained irregular intervals.
On the retained core, the 2015–2025 annualized rate is approximately 7.10%, compared with 6.71% for the scaled monetary proxy. The core’s earlier half-decade is approximately 8.67%; the later half-decade is approximately 5.55%. These describe selected endpoints and coverage, not a law that every asset’s growth must slow.
The historical observations are useful context. They do not by themselves establish causality, a stable money-to-asset response coefficient, or the next 25 years of growth.
[MODEL]What this history does not tell us
It does not prove that faster M2 mechanically causes a particular Bitcoin return. It does not show a smooth, universal trend for every store of value. It does not measure the amount of each market that Bitcoin can take.
Nor does a larger dollar addition prove accelerating percentage growth. A larger base can produce a larger dollar increase at the same or even a lower annual rate.
The practical standard for this educational model is traceable evidence and correct mathematics. Sparse endpoints remain sparse. Interpolations and bridges stay labeled. A growth assumption does not become a fact just because the program reproduces it.
[MODEL]