
The work behind the calculator.
Read offline. Inspect the inputs. Reuse the model-derived charts. Every public resource here is tied to this release.
The full methodology guide
A reader-friendly PDF with the model, historical evidence, equations, assumptions, charts, and linked sources.
Read the guideThe model on one page
The key equation, current default, evidence boundaries and major sensitivity in a printable briefing.
Download one pageStandalone calculator
One self-contained HTML file. Calculator works offline; external educational/source links require the accompanying site or internet.
Download calculatorThe chart package
Eight separate charts in SVG and high-resolution PNG, each with its machine-readable data. Download any chart individually from the chart library below.
Browse the chart libraryPreset calculation table
Every preset, every retained macro path, all three milestones. Full-precision values in CSV.
Download calculated dataFrozen model inputs
The exact model values, presets, labels and limitations used by the website and calculator.
Download model JSONChart library
Lines between historical anchors or milestone assumptions are visual guides, not additional observations or an estimated annual Bitcoin path.
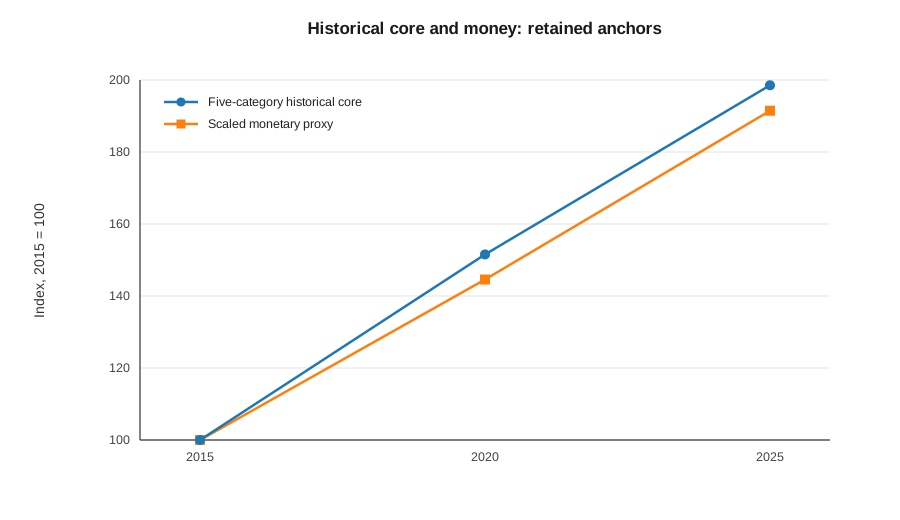
SVG · PNG · CSV
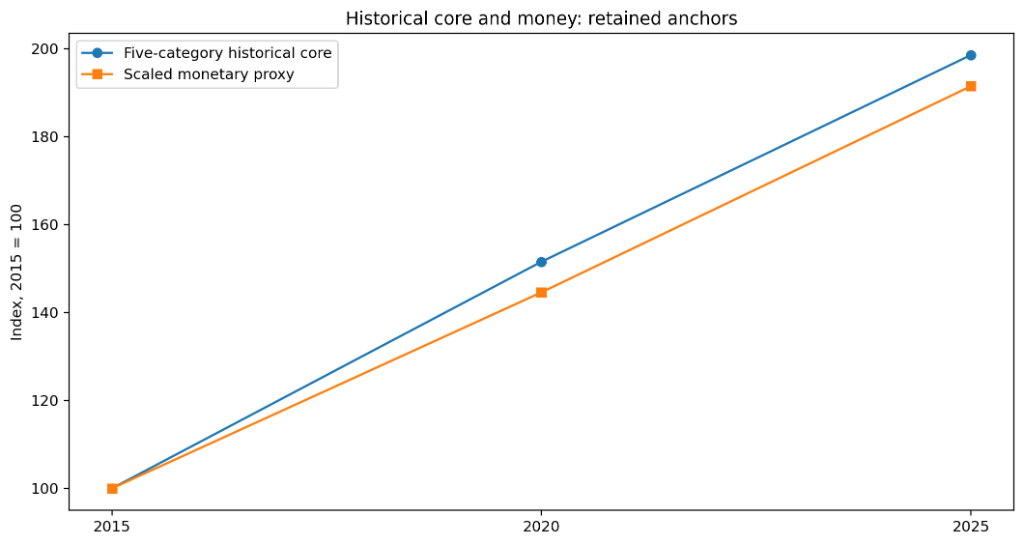
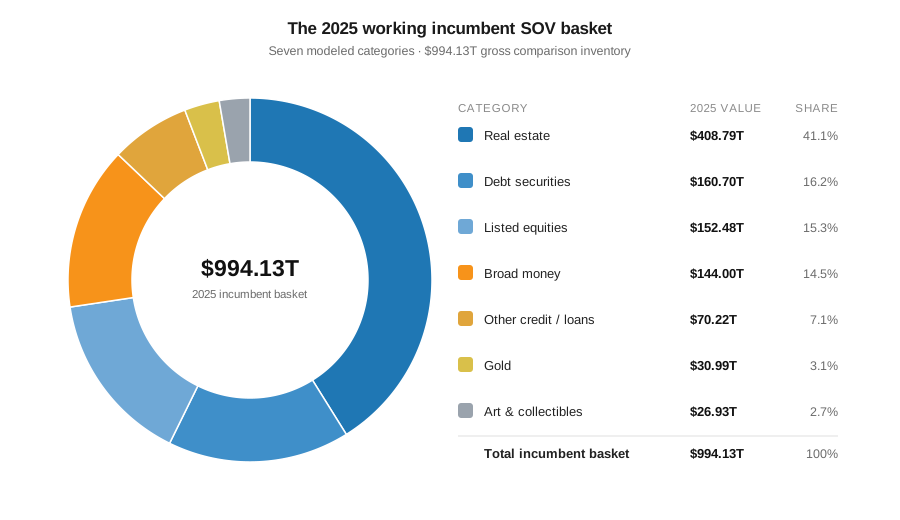
SVG · PNG · CSV
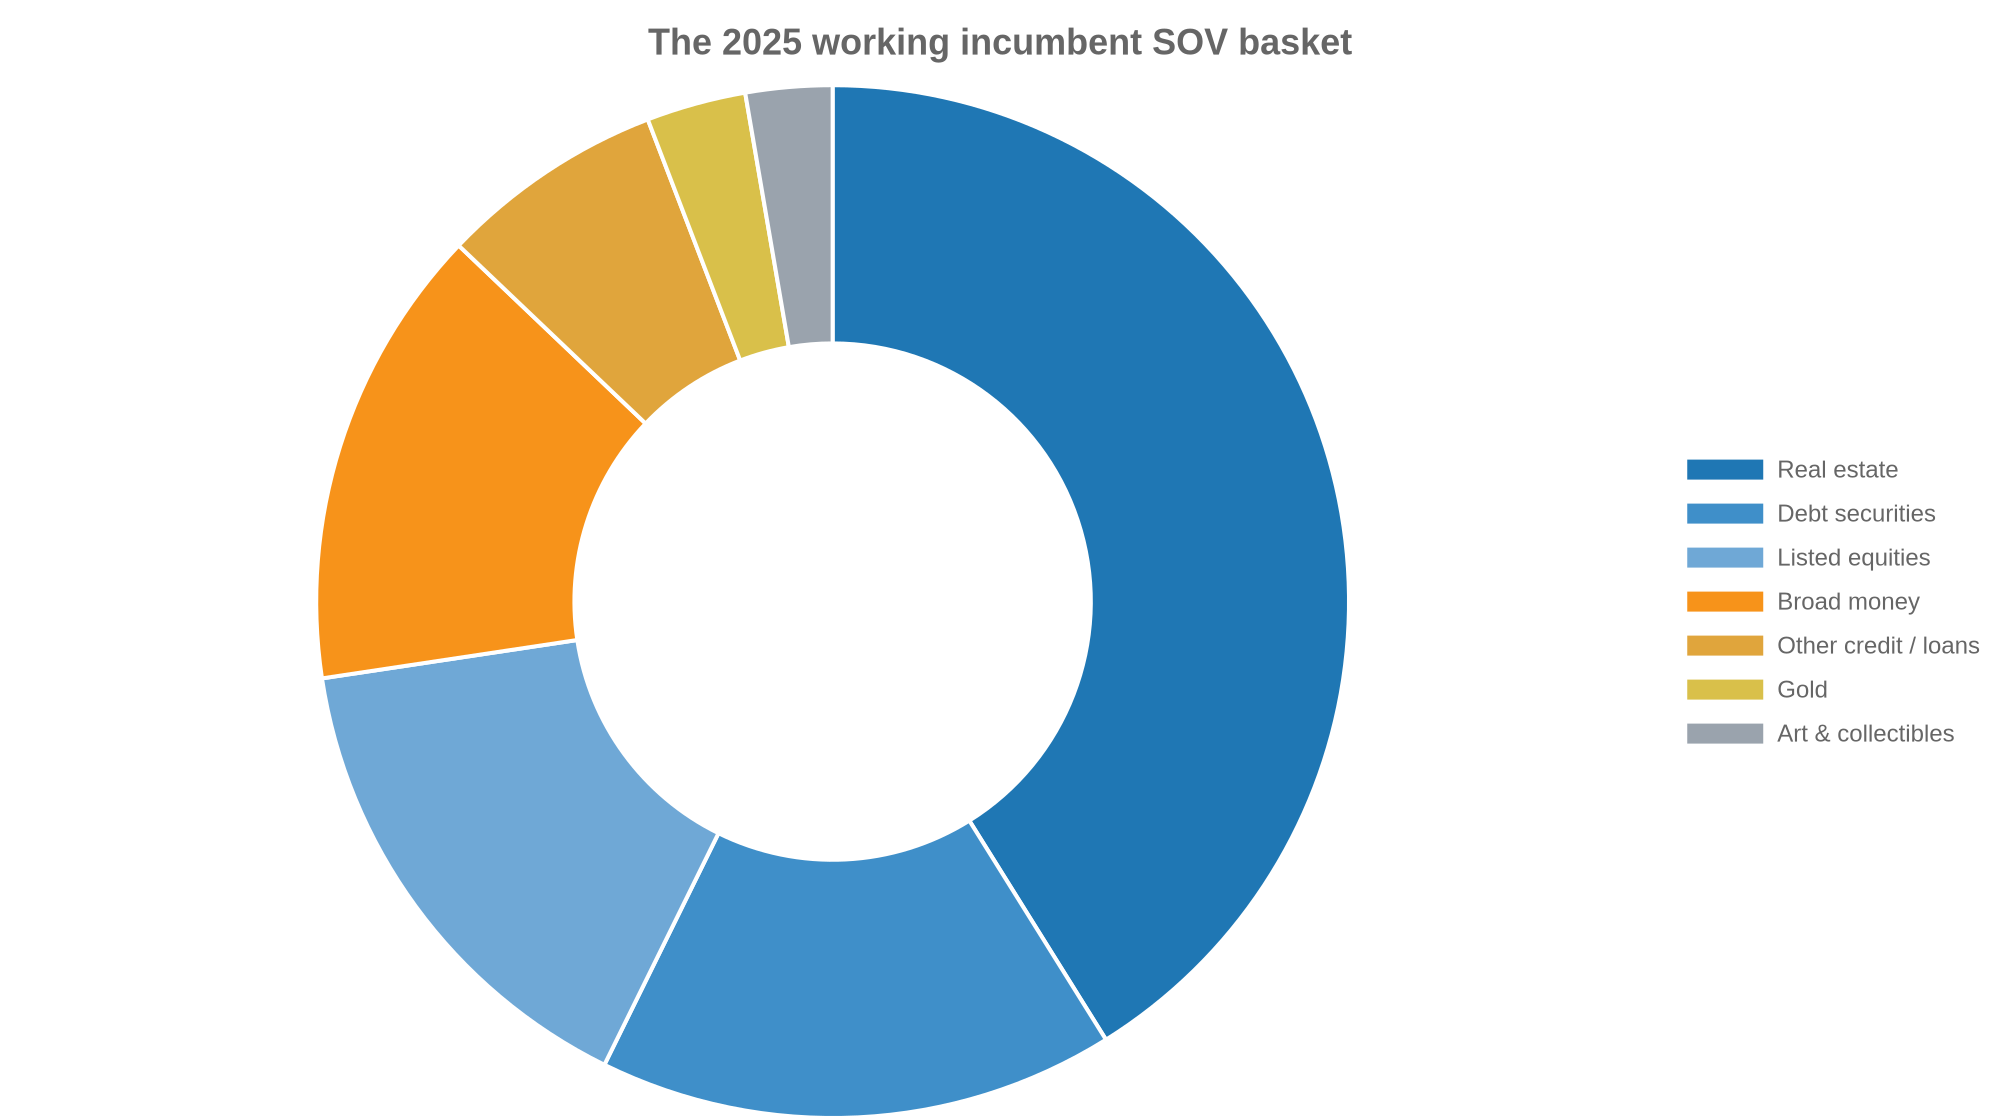
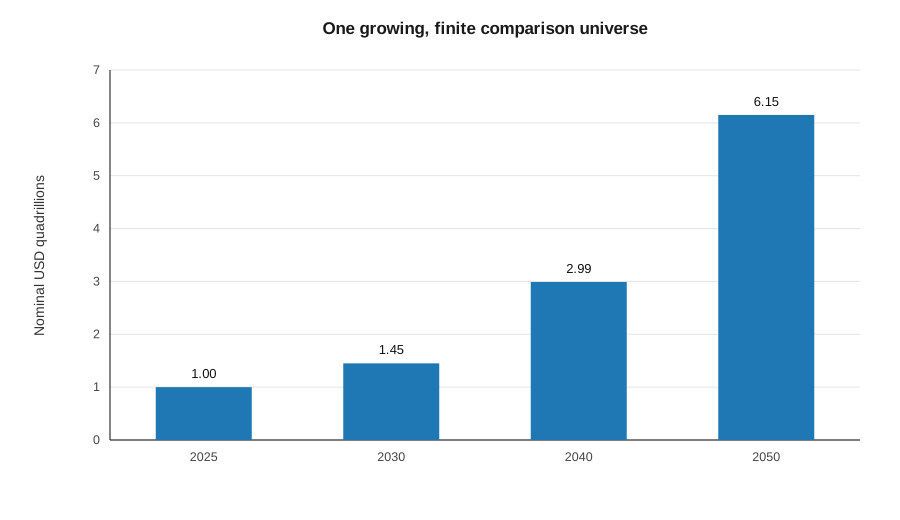
SVG · PNG · CSV
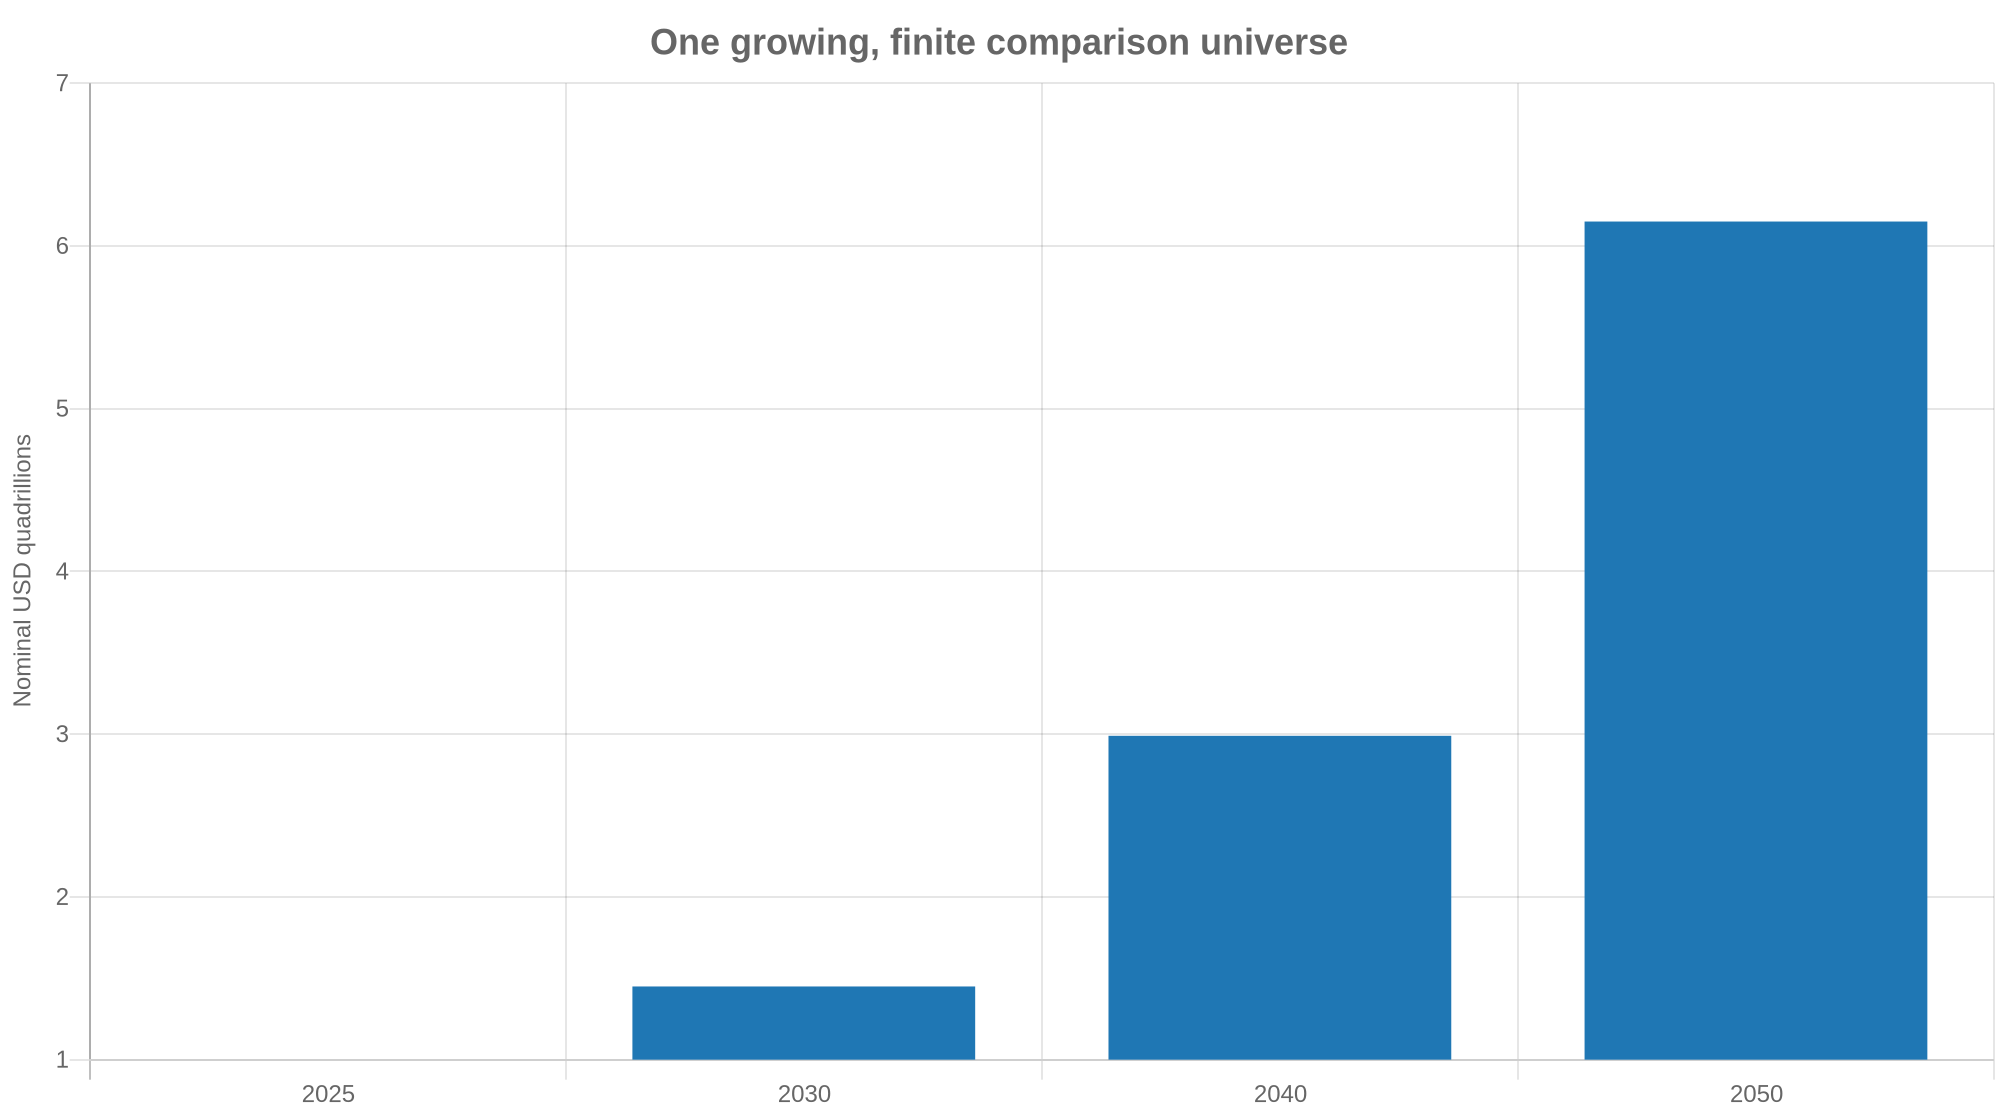
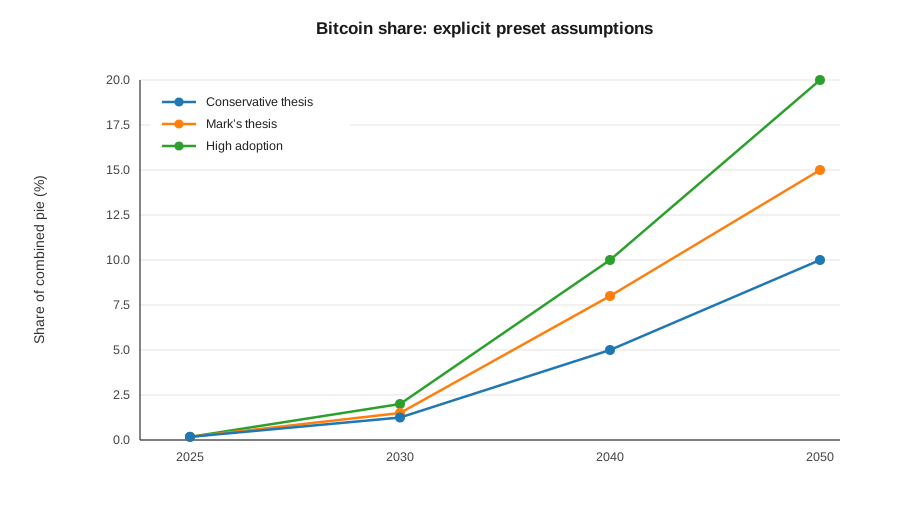
SVG · PNG · CSV
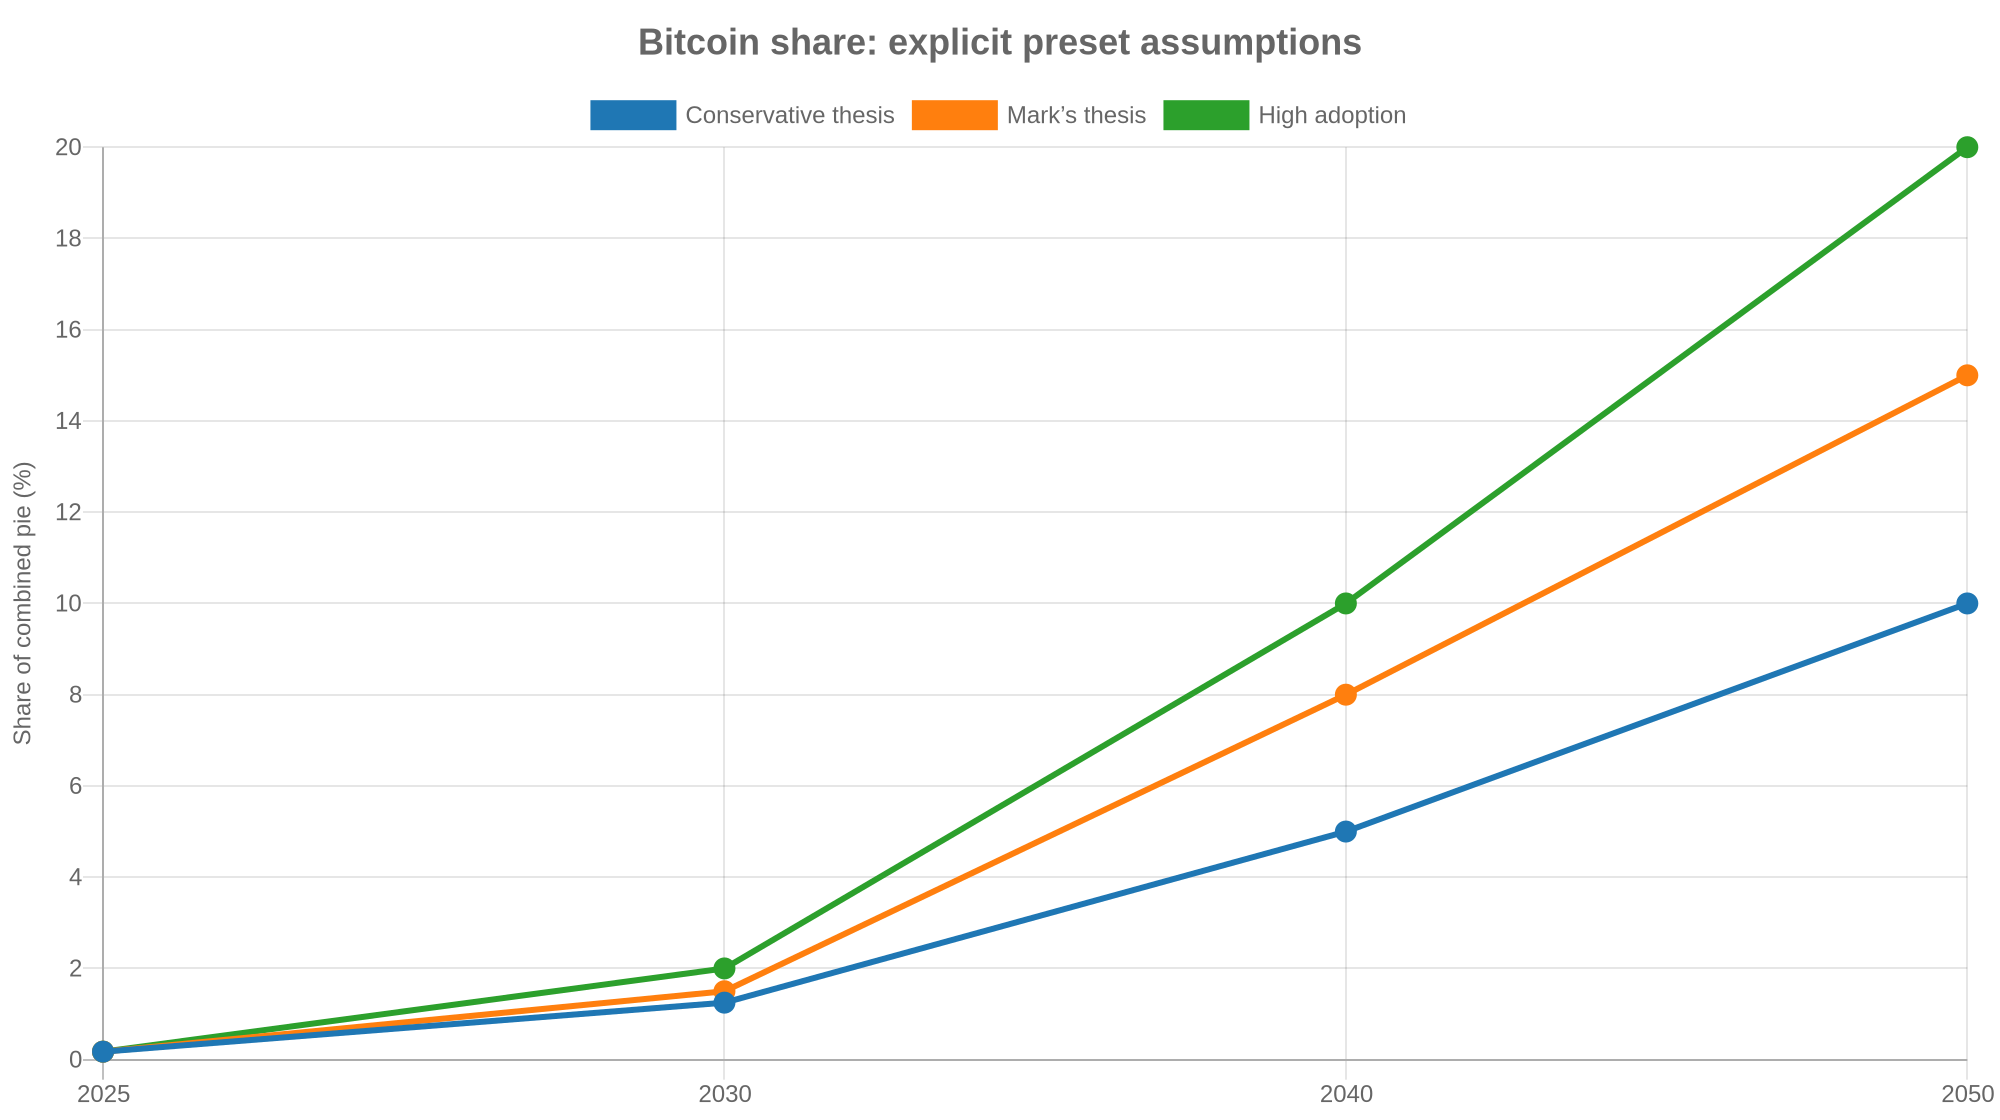
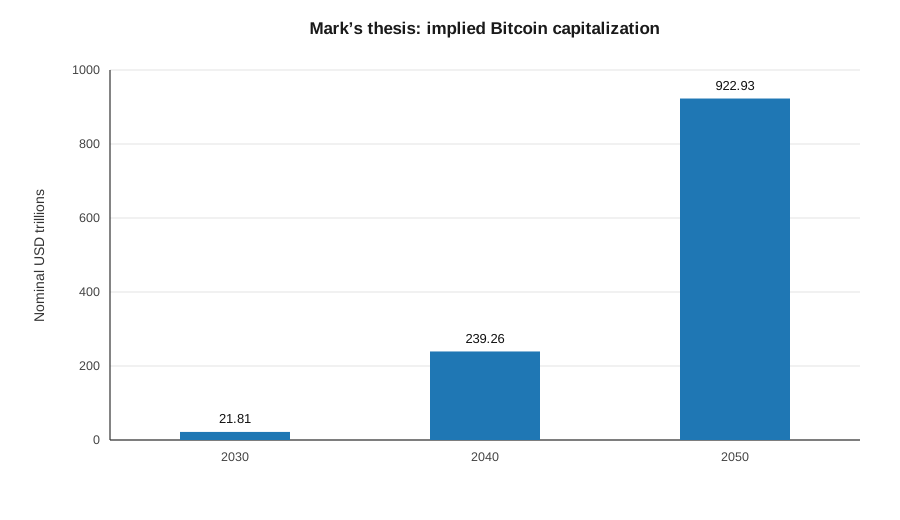
SVG · PNG · CSV
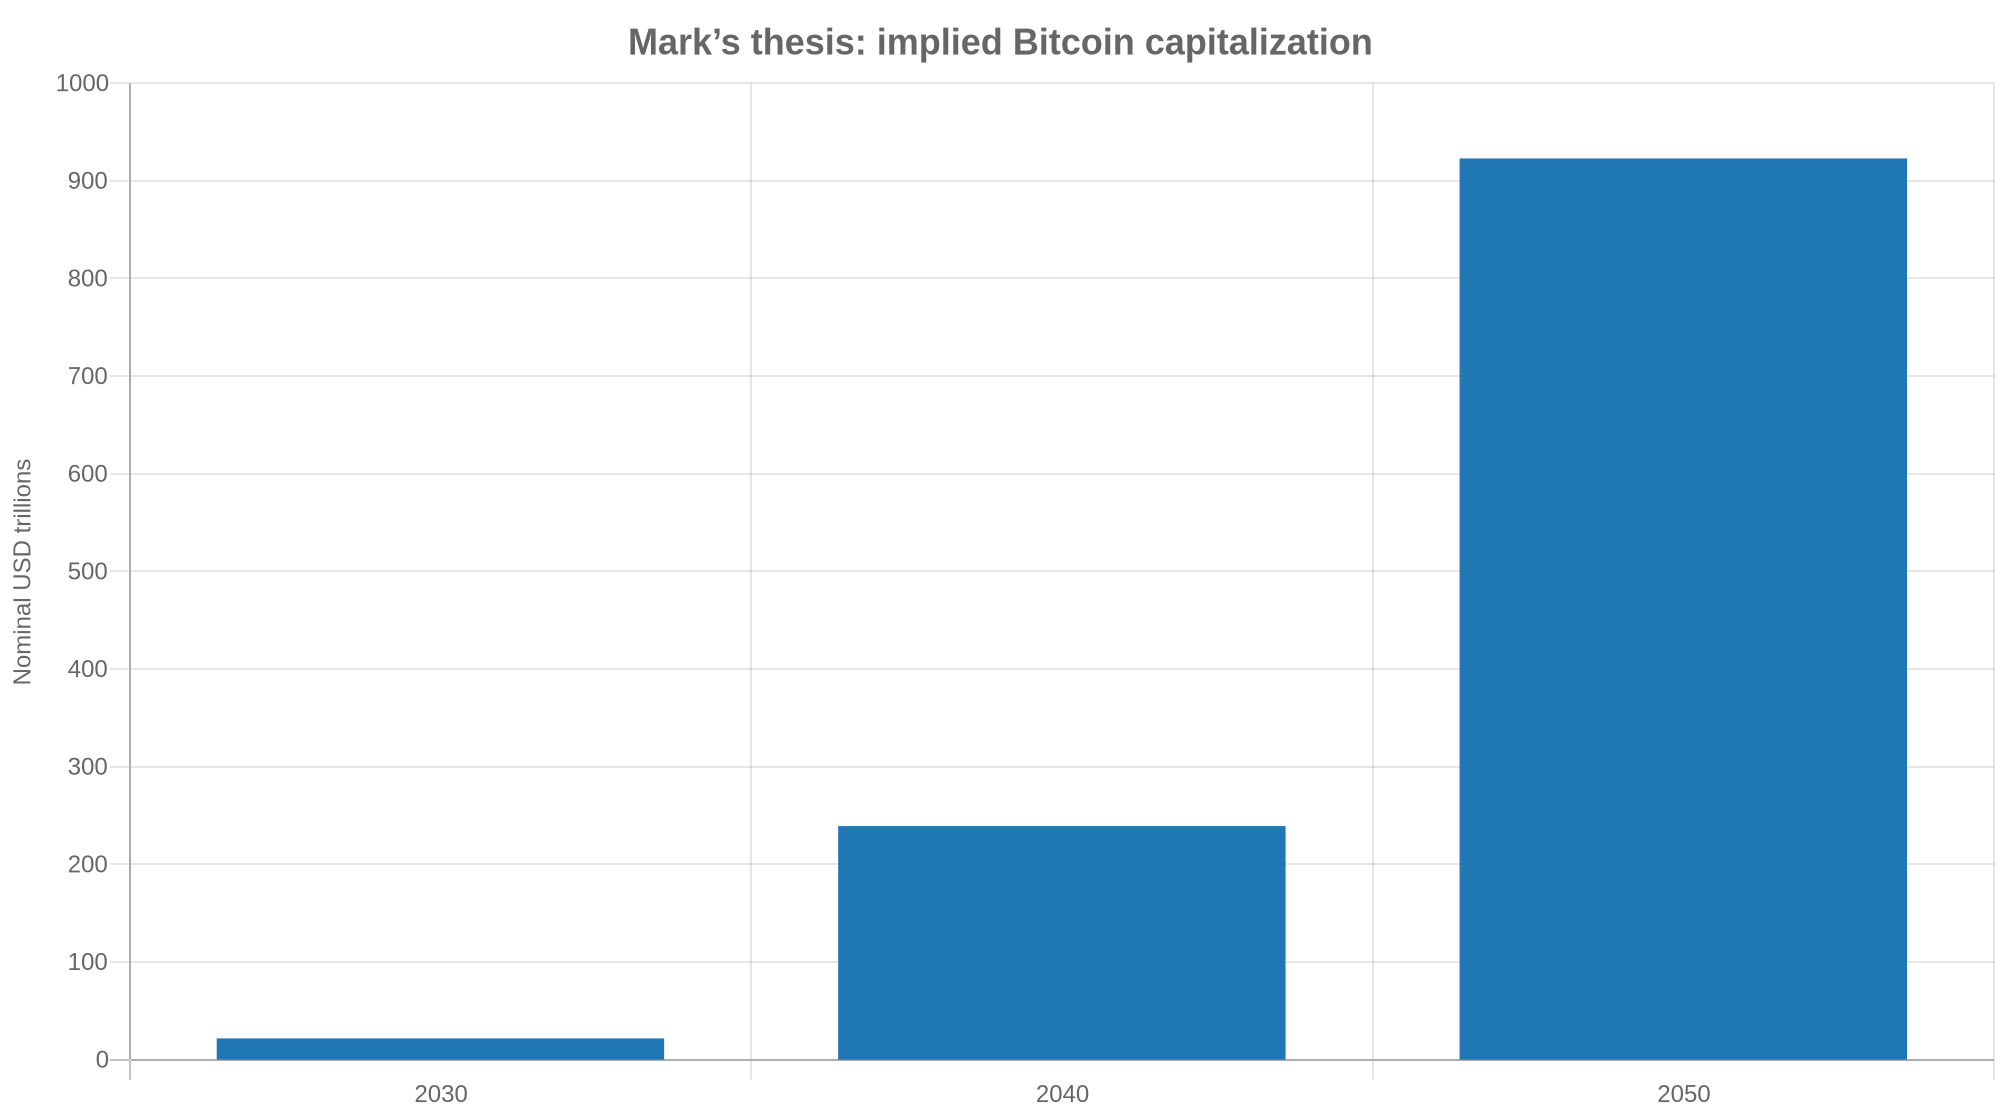
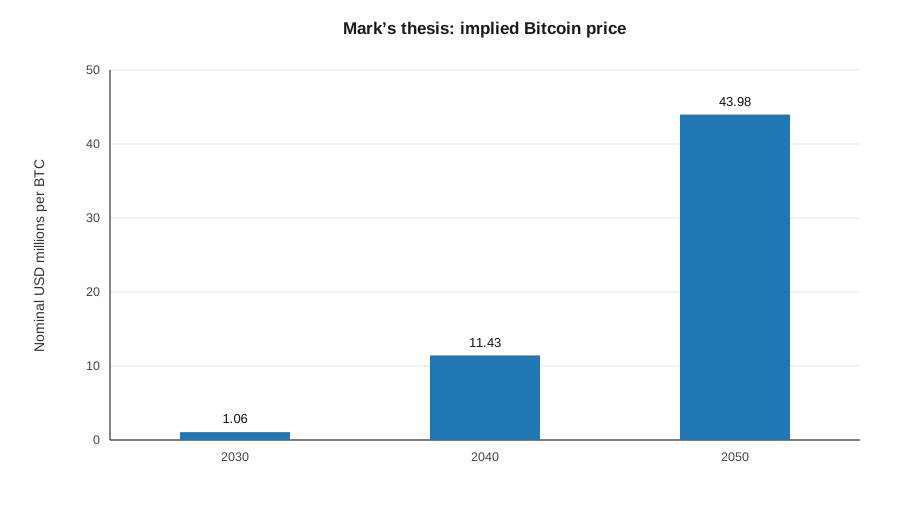
SVG · PNG · CSV
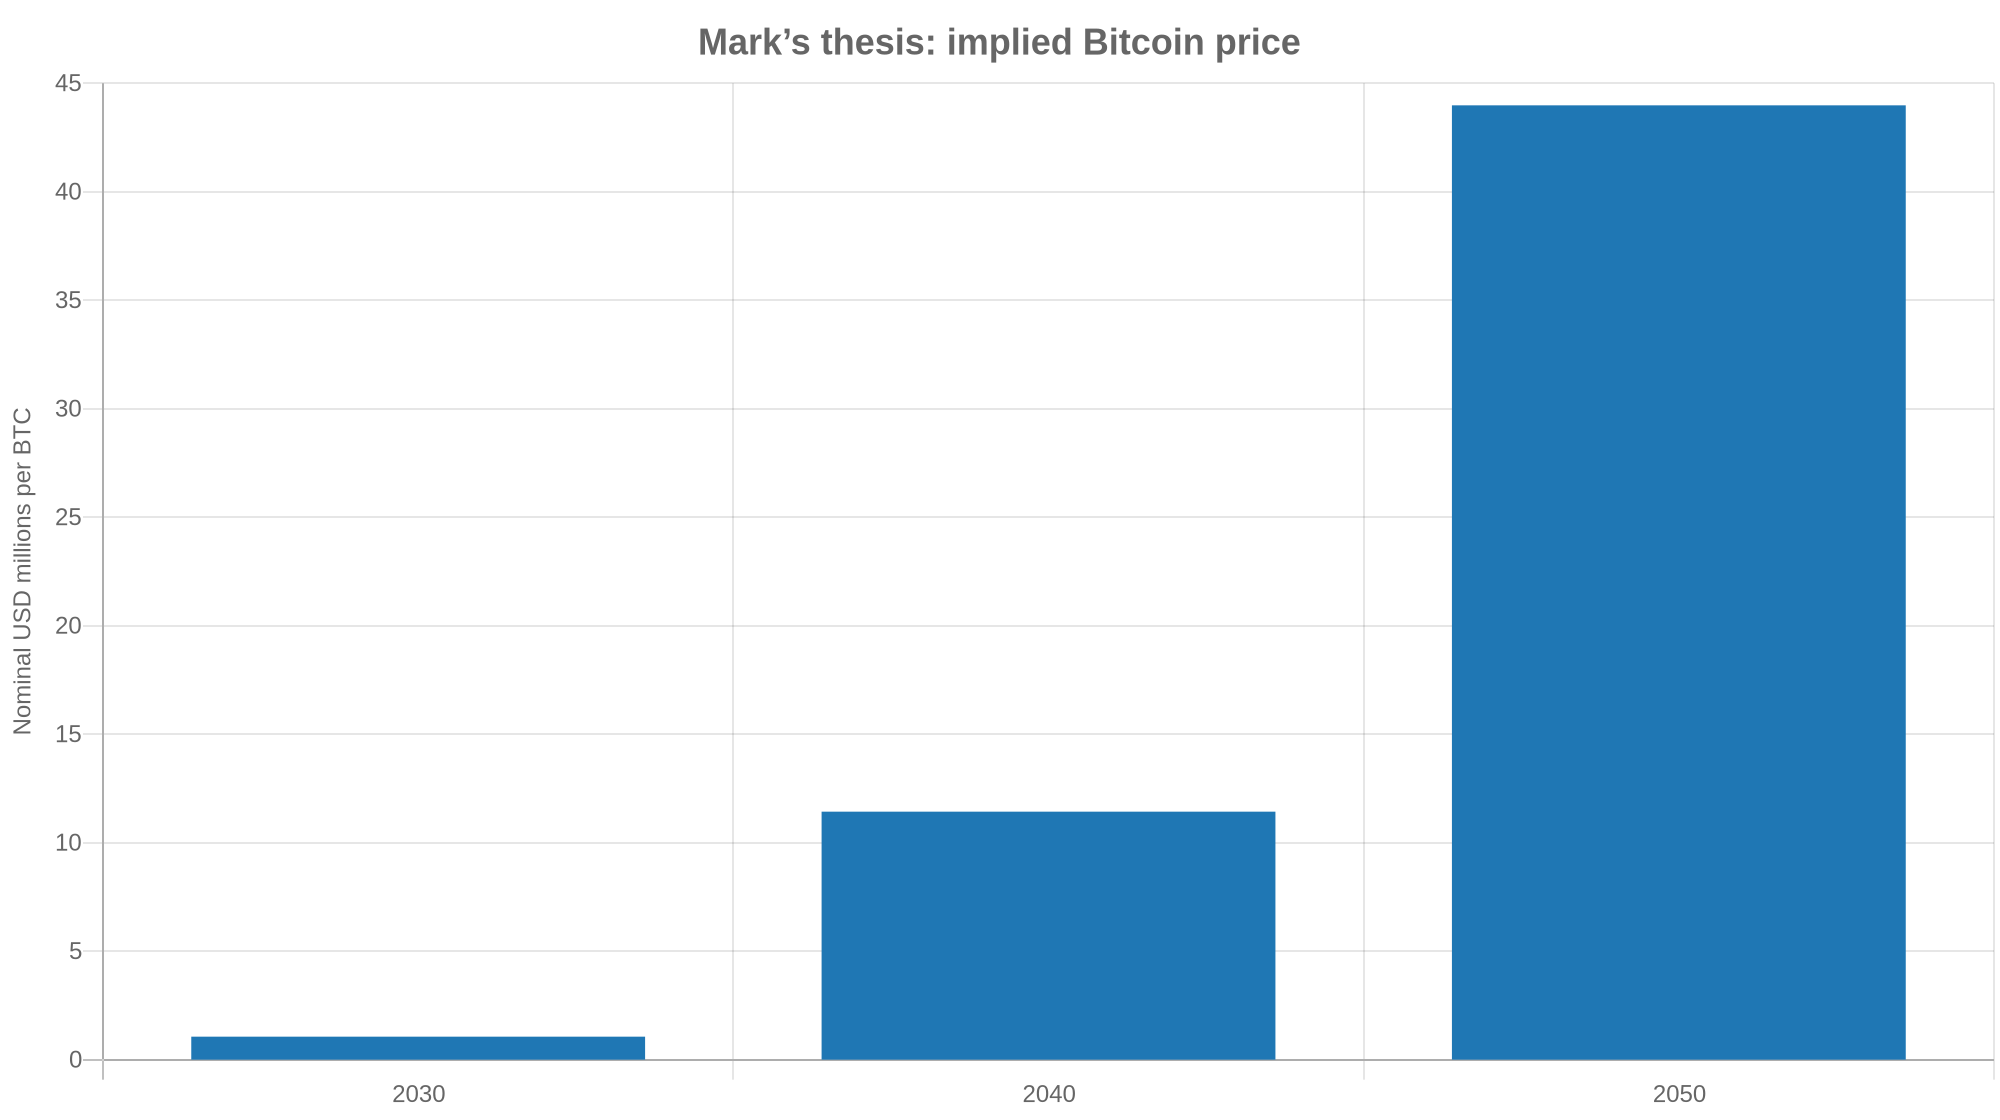
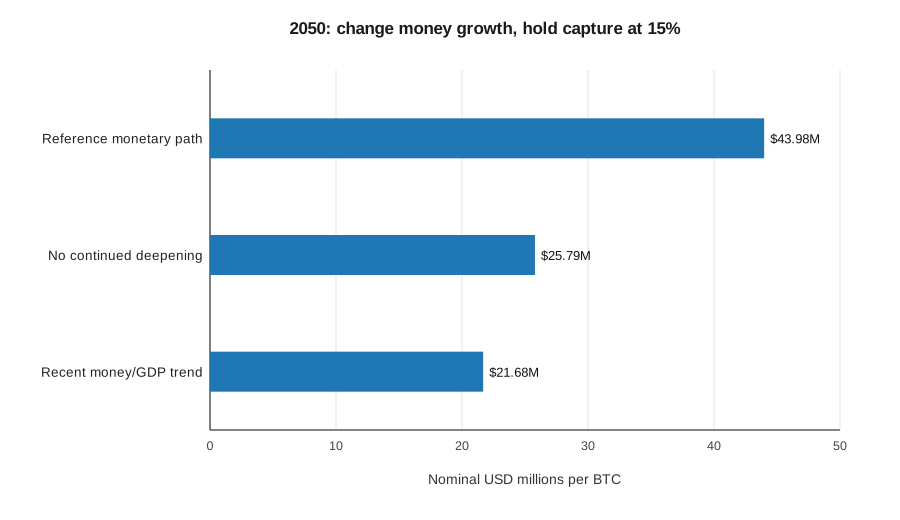
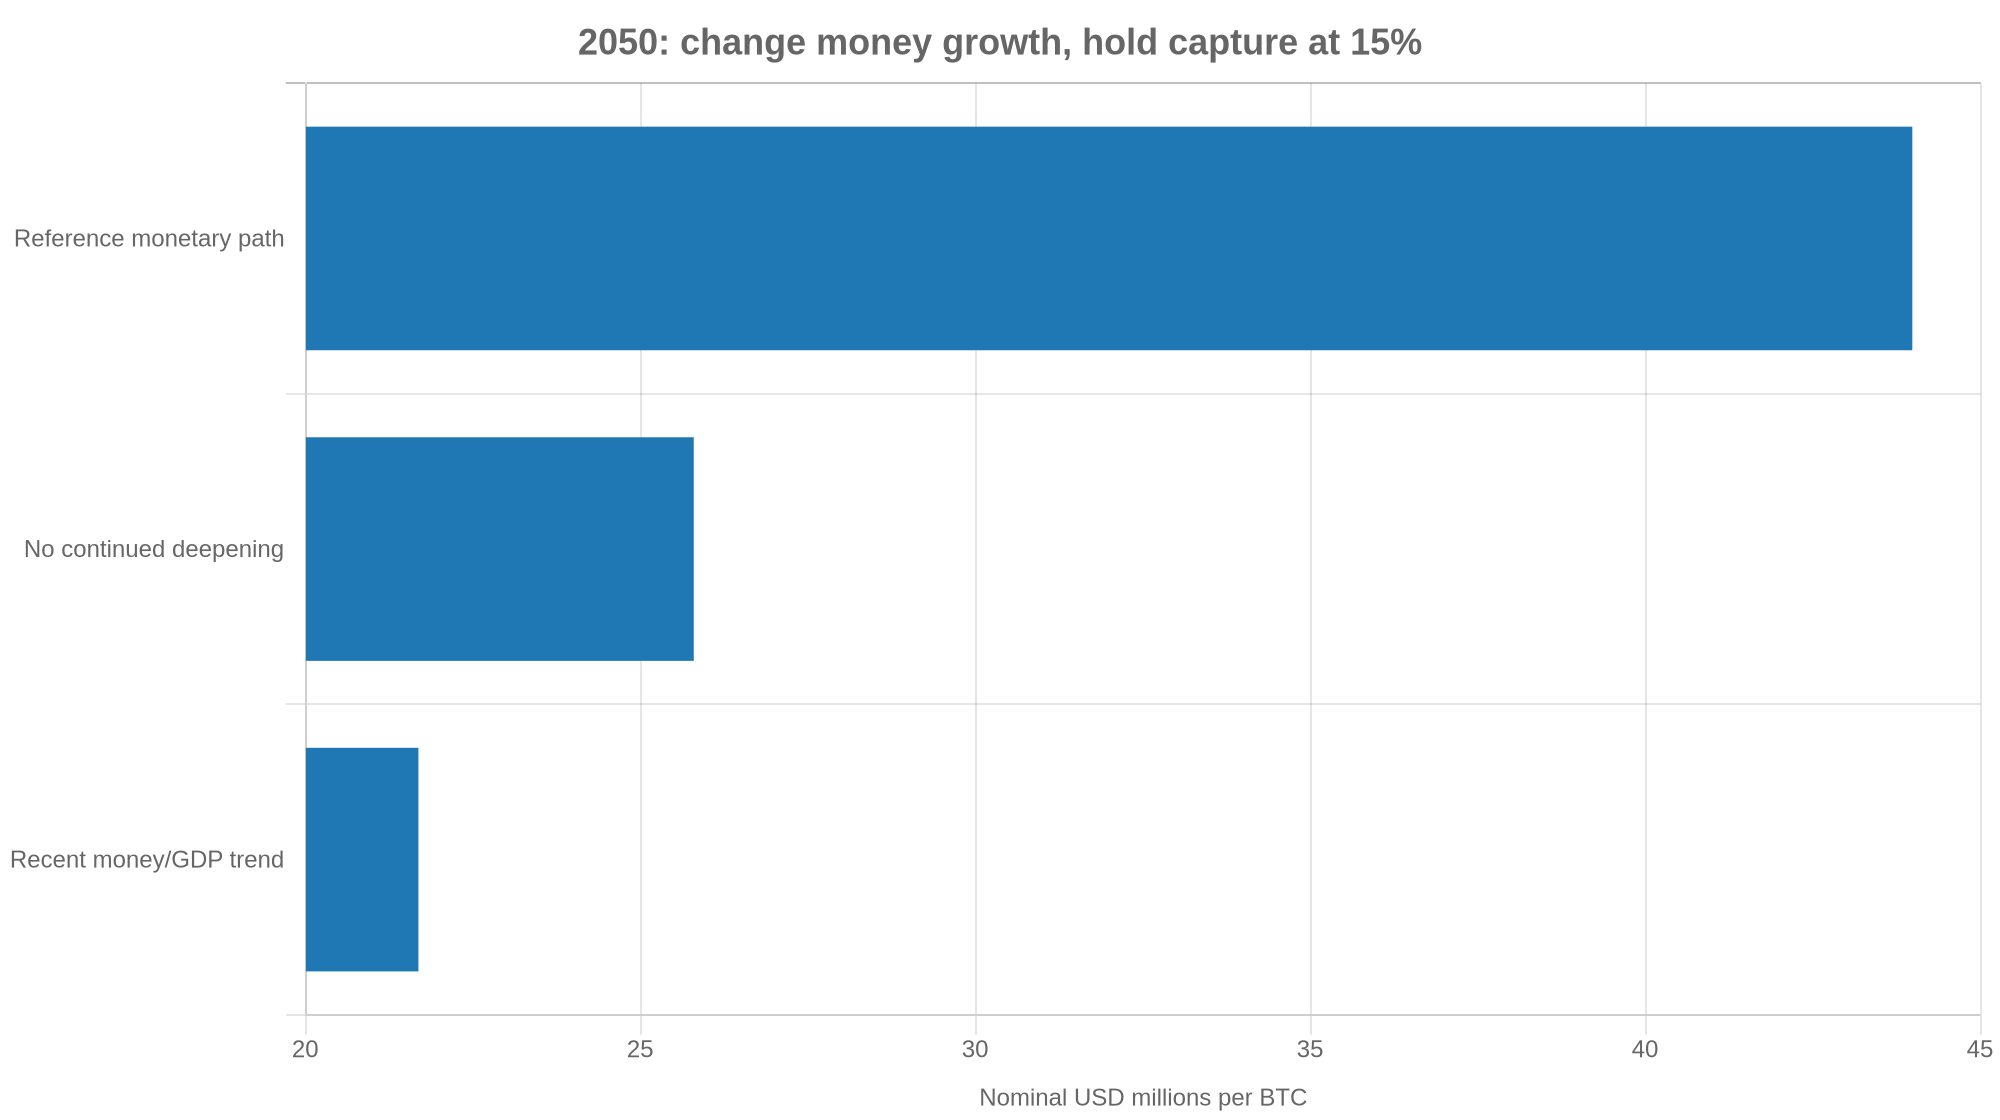
SVG · PNG · CSV
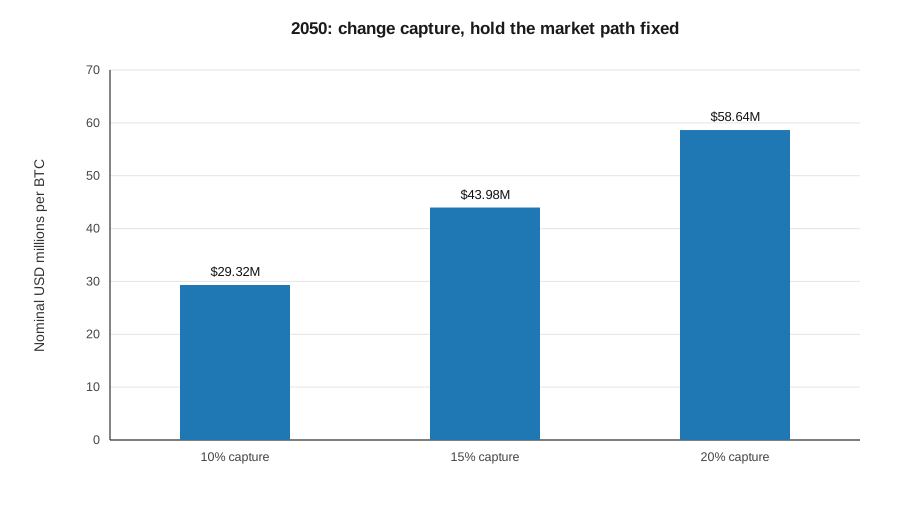
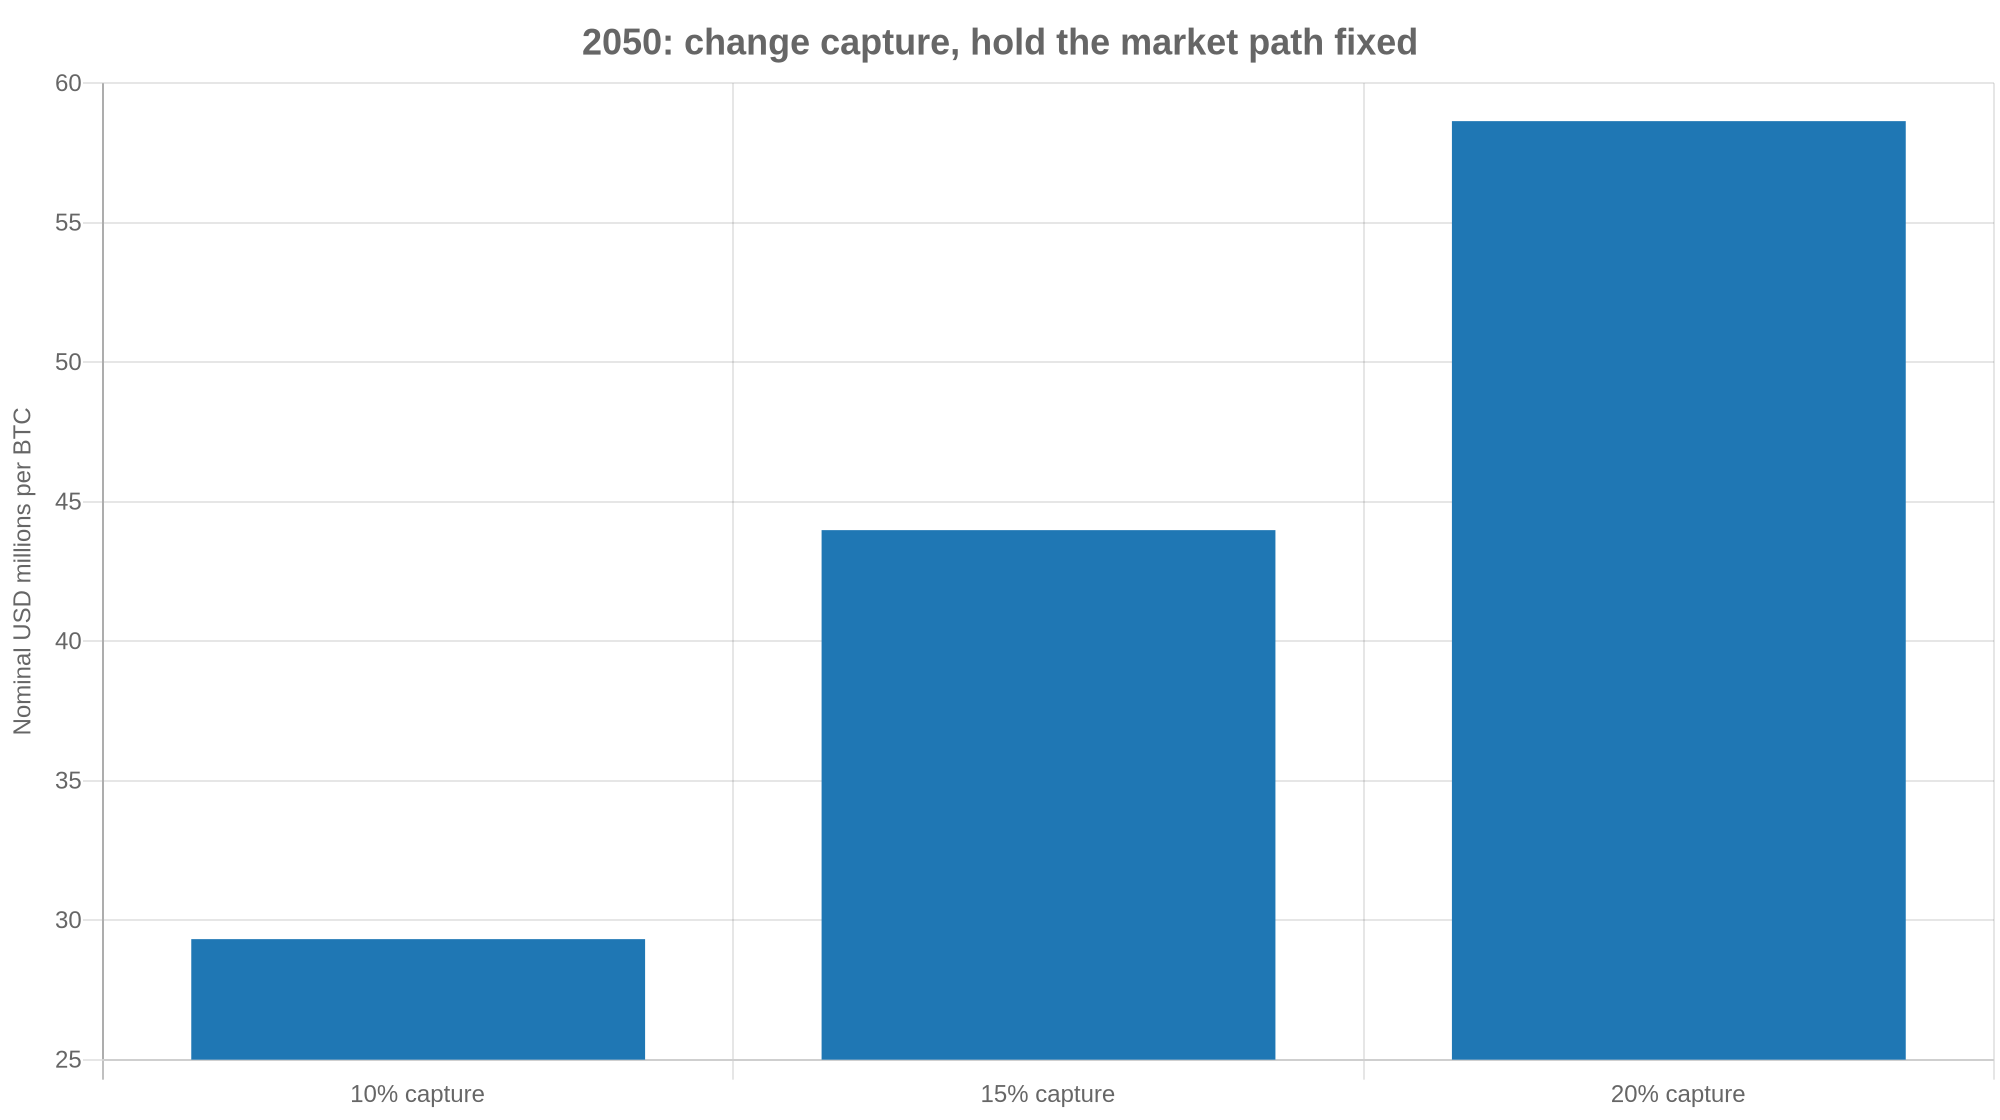
SVG · PNG · CSV
Targeted evidence tables
Credit instrument bridge · Loan inputs · Historical anchors · Frozen composition · Source registry