Follow the active path
The calculator does not choose seven unrelated future asset returns. It first projects money, then the size of the non-money pool relative to money. Asset weights allocate that pool. Changing a category’s relative-weight assumption changes the mix, not the externally determined total.
The active institutional starting point is the retained April 2026 IMF nominal-world-output series at market exchange rates. The published table includes $118.176T for 2025 and $158.392T for 2031. These are economic-output levels, not SOV stocks and not amounts added directly to the basket.
[MODEL][IMF-GDP]From economic output to the money path
The historical monetary proxy combines U.S. M2, China M2 and euro-area M3. In the reference path, the model preserves the 2018–2025 log-growth difference between that proxy and nominal world GDP. This is the monetary-deepening assumption: money continues changing relative to the scale of economic activity.
The retained reference drift is approximately 0.021341 log units a year. The shorter 2020–2025 alternative is approximately −0.006947. Those periods tell different stories. The reference implies roughly 7.02% annual money growth through 2050; it is not a reliable law estimated from a long stable sample.
The world-scale baseline uses $144T, while the historical relationship uses a narrower geography. Applying a constant scale does not make that history a direct observation of every country’s money supply.
[MODEL][M2US][M2CN][M3EA][MONEY]From money to the finite pie
Let M be money and N be the non-money store-of-value pool. The model carries forward the selected historical drift in N/M. The retained annual log drift is 0.005784, approximately 0.58% in log terms.
That drift was calculated from the available gold-property-equity numerator relative to money over 2015–2025. Bonds were omitted from that calibration because of the source break; art lacked comparable history. Applying the drift to the larger current pool, including added loans, is a disclosed transfer assumption.
Money plus the non-money pool gives the incumbent total. A small starting-state bridge includes existing Bitcoin once, giving the combined comparison used for the price calculation. No separate credit-growth, inflation or AI multiplier is added on top.
[MODEL]What each institution does and does not supply
| Source | Role in v1 | Not a claim that… |
|---|---|---|
| IMF WEO[IMF-GDP] | Active upstream nominal-GDP path feeding modeled money. | The IMF forecasts a $6.15Q SOV universe. |
| IMF Fiscal Monitor + IIF[IMF-FM][IIF] | Retained government/private/financial credit diagnostic. | Public-debt growth is applied to every asset. |
| BIS[BIS-GLI] | Definitions and credit/liquidity cross-checks. | BIS publishes the model’s global-M2 path to 2050. |
| CBO[CBO] | Long-term U.S. fiscal cross-check. | U.S. federal debt is a world-money forecast. |
| PBOC / Fed / ECB[C01][C04][C05] | Selected additional loan stock inputs. | The covered loan subset is all global lending. |
These roles are not a single sequential chain in which every source causes the next calculation. In the released finite-pie engine, CBO and the retained BIS liquidity commentary are context rather than active multipliers.
Where institutional forecasts stop
The retained IMF appendix supplies 2025, 2026, 2027 and 2031 nominal-output levels. Values for 2028–2030 are geometric model interpolations. After 2031, the model extends the 2027–2031 terminal GDP growth rate, approximately 4.68%, and continues the selected monetary-deepening assumption.
CBO’s long-term material has its own U.S. horizon. Its existence does not turn the global 2040 and 2050 paths into institutional forecasts. The extension is the model’s choice, and the source library preserves that distinction.
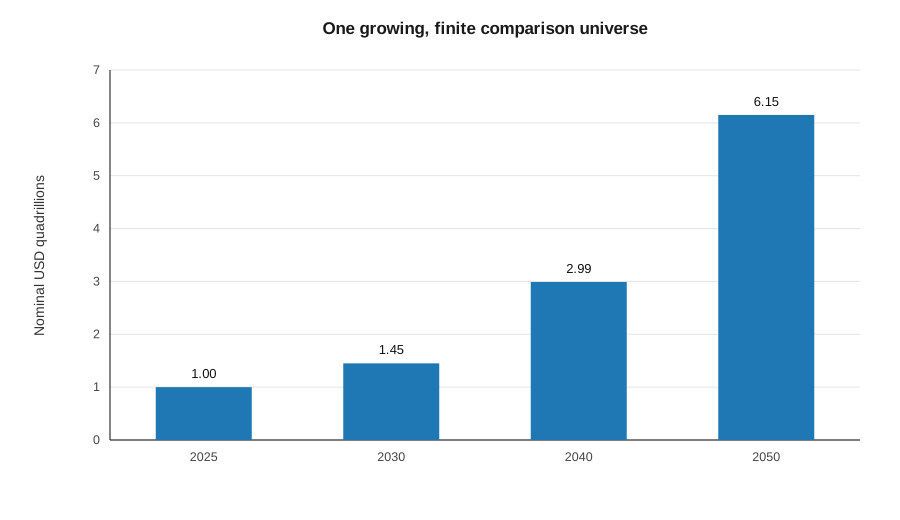
[IMF-GDP][IMF-FAQ][CBO][MODEL]| Year | Combined reference pie | Treatment |
|---|---|---|
| 2030 | $1,454.23T | Conditional model output |
| 2040 | $2,990.69T | Conditional model output |
| 2050 | $6,152.87T | Conditional model output |